DRTS-9000
法規格式轉檔暨報表系統
Data Report and Transmission System
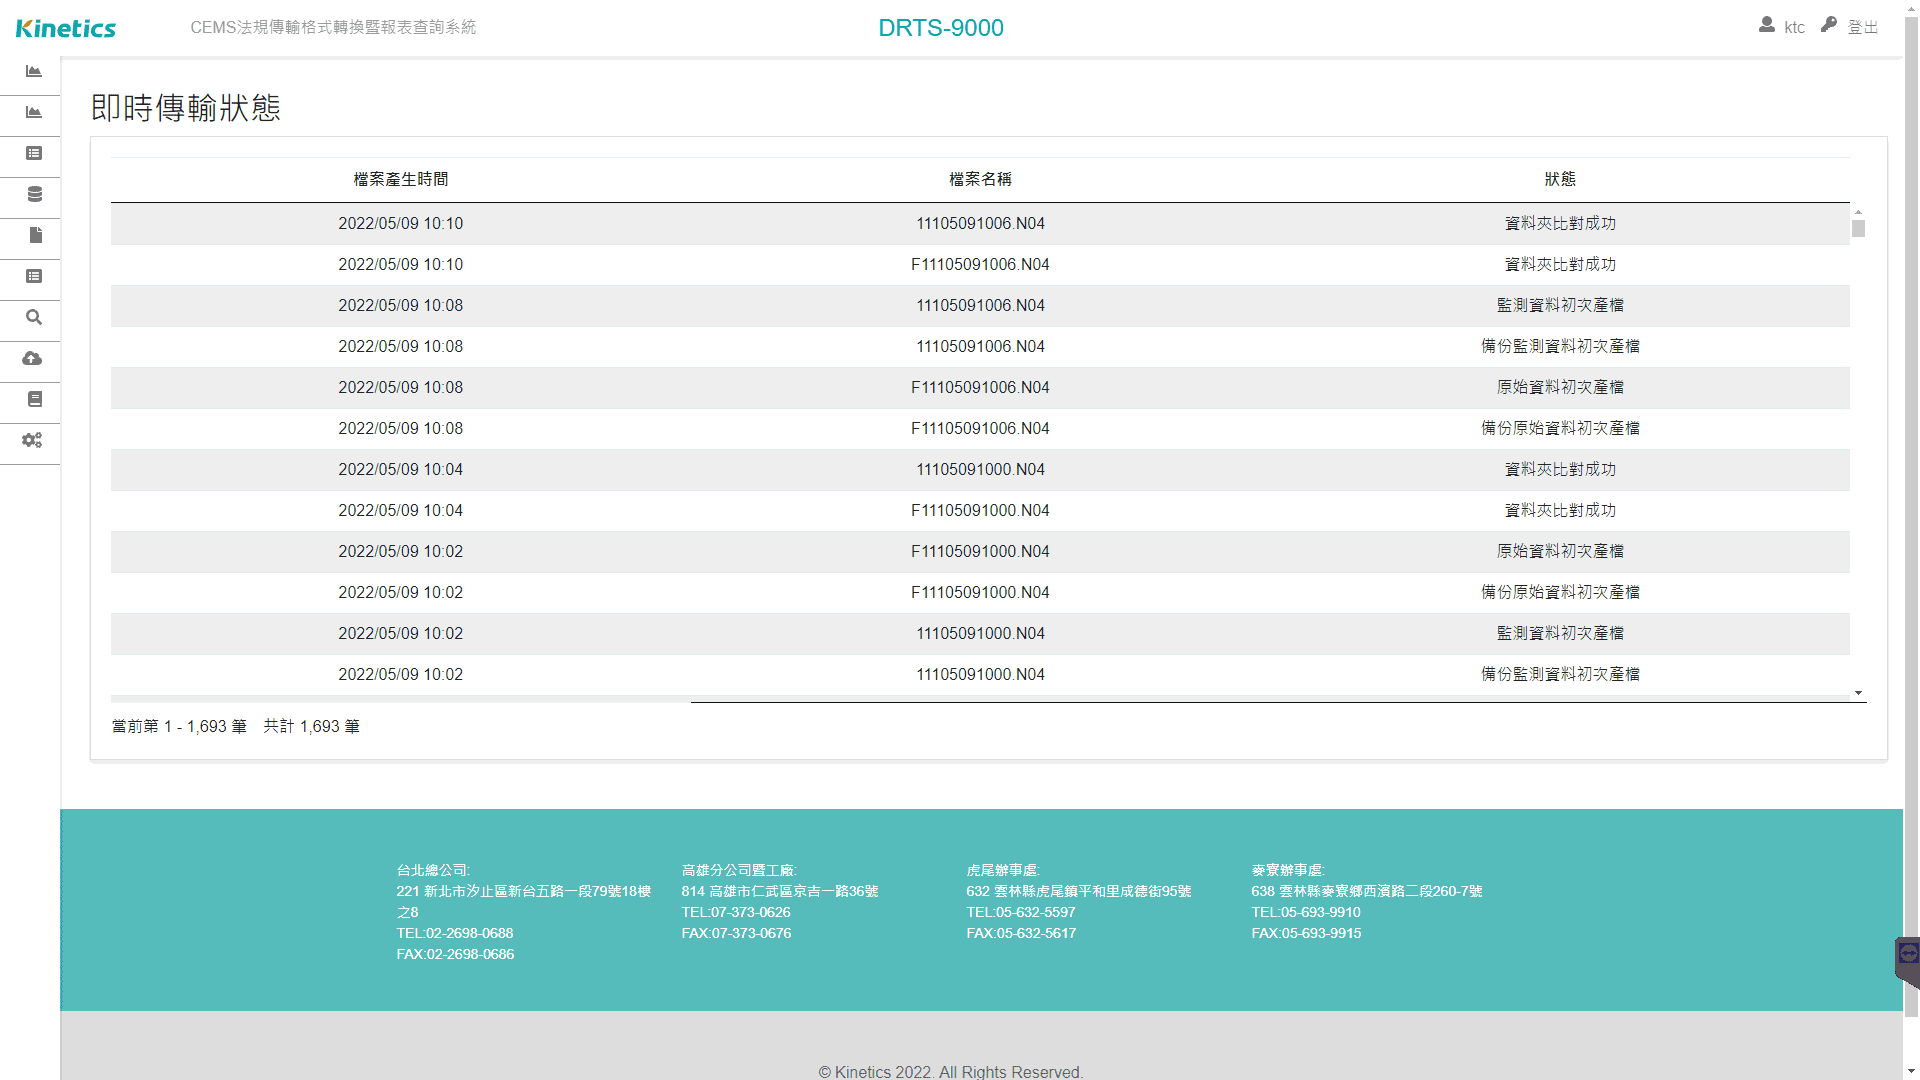
- 傳輸檔案產生一式兩份,分別儲存於指定環保局傳輸資料夾及備份資料夾,並於網頁上以記錄型態顯示,便於觀看/檢查是否正常運作。
- 依照法規所規定頻率自動產生符合規定之傳輸格式檔案,包含原始數據、不透光6 分鐘監測數據、其他測項15 分鐘/ 小時監測數據,日報於每日十點自動產出,月報於每月十號凌晨零點自動產出。
- 各項傳輸檔案產出時,檢查所產生檔案內容是否缺漏;自動判定傳輸正常與否;若有任何異常則以Email/Line 方式傳送指定位址/ 群組告警。
睿普產品
DRTS-9000 法規格式轉檔暨報表系統為睿普工程針對傳輸環保 局將資料庫數據轉換法規格式及方便客戶監視即時狀態、查詢 歷史數據及提供相對準確度測試查核報告、氮氧化物轉化效率 測試等輸入需求所開發之純網頁介面軟體,客戶無須安裝任何 第三方軟體以內建瀏覽器即可直接監看、使用。
系統功能介紹
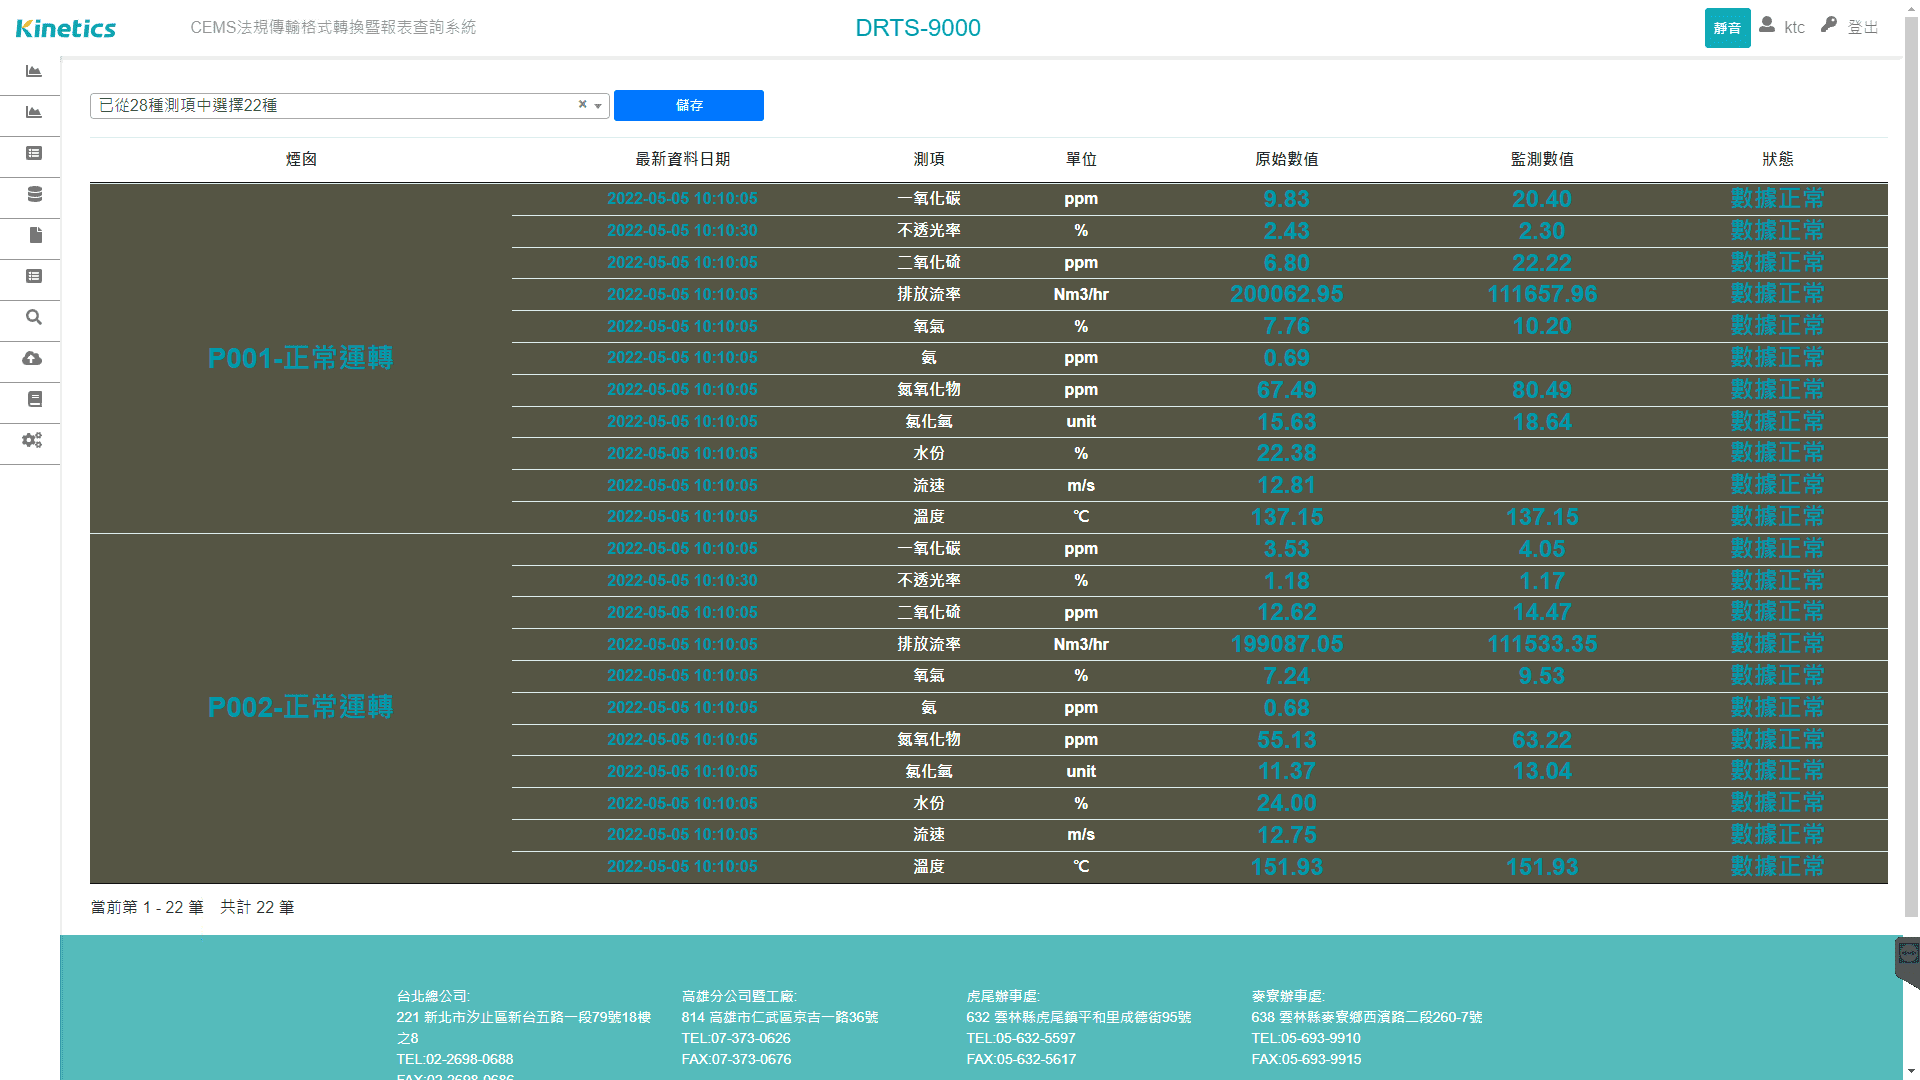
- 總覽,可設定、選擇欲觀看項目,顯示最近一筆原始數據、監測數據及其狀態;若數據超過 5 分鐘未更新或狀態非正常則會以文字 + 顏色表示告警。
- 即時原始數據,提供各測項最近一筆分鐘值原始數據頁面,並顯示其該分鐘狀態、最近 60 筆資料所構成趨勢圖 (趨勢圖 Y 軸範圍可個別設定顯示)。
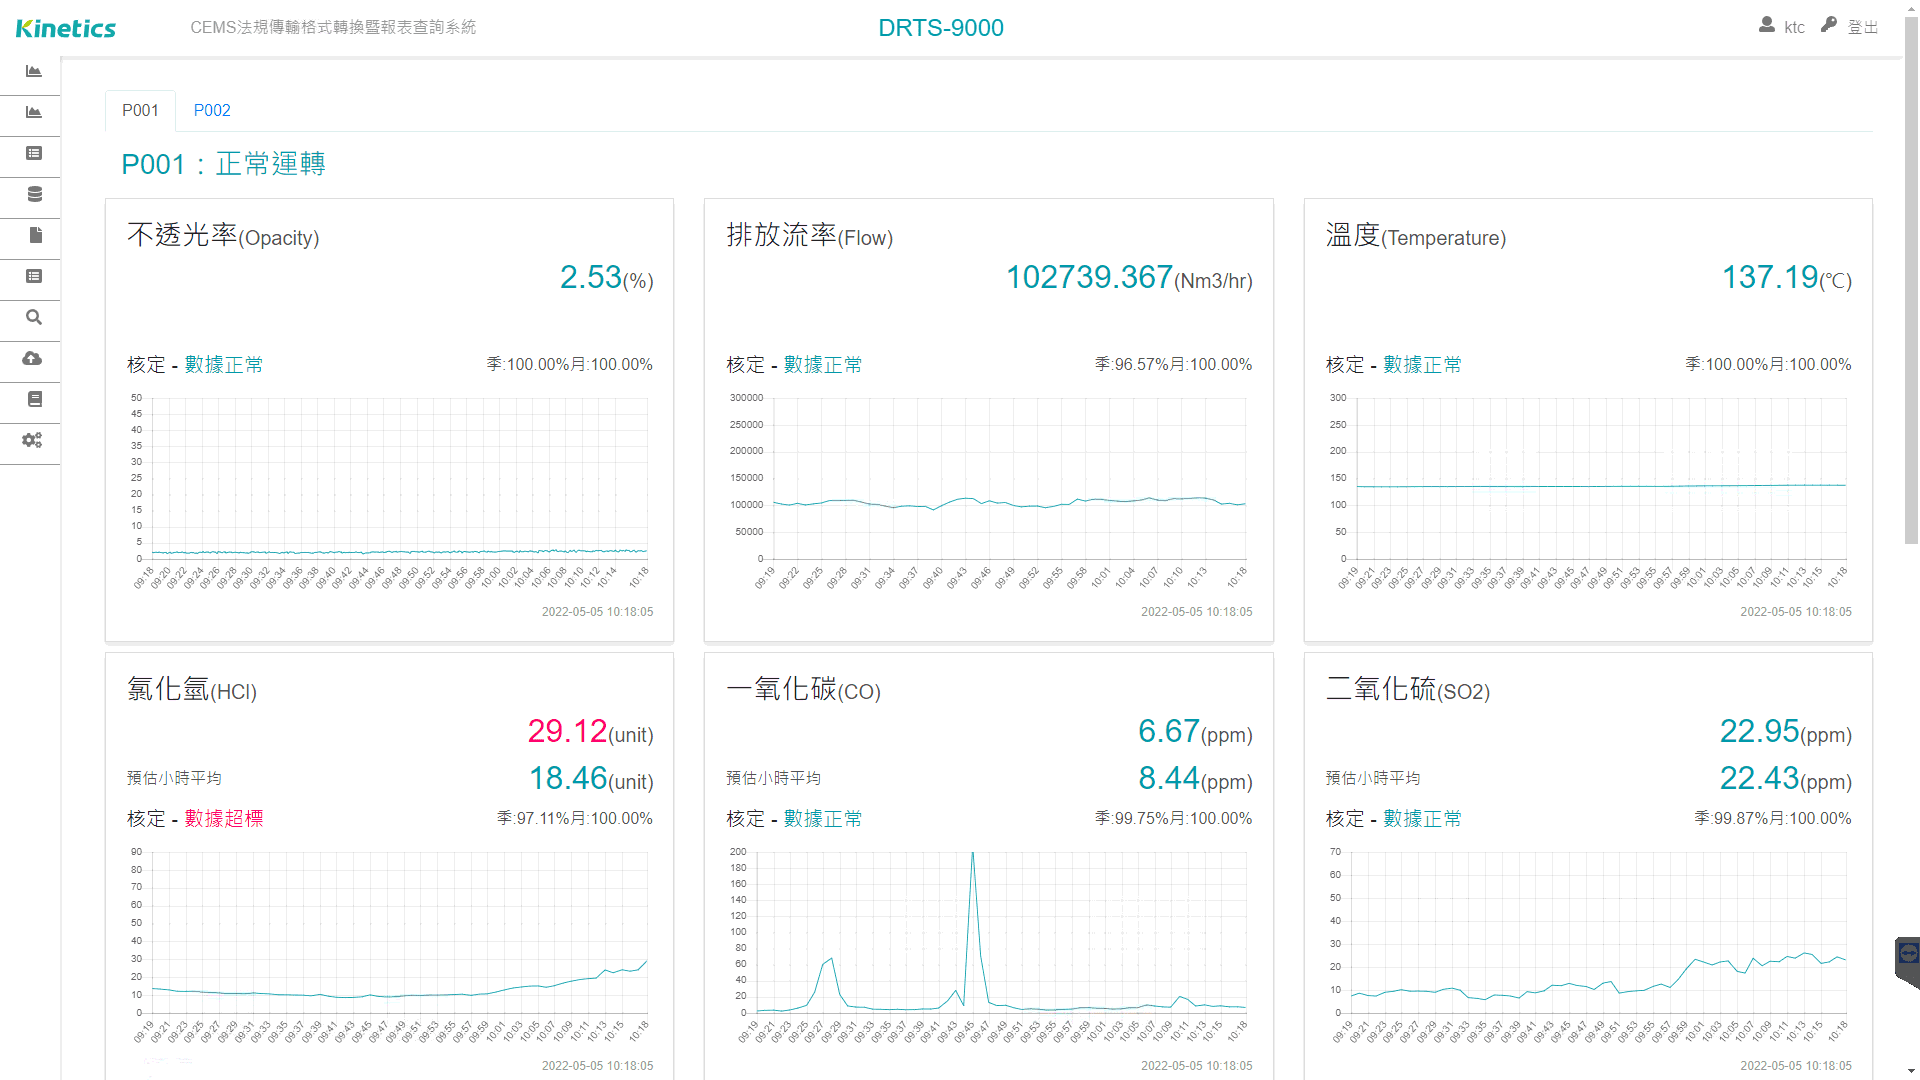
- 即時監控數據,提供須上傳測項最近一筆分鐘值監測數據頁面,並顯示其該分鐘狀態、本月/本季有效數據百分比、最近 60 筆資料所構成趨勢圖 (趨勢圖 Y 軸範圍可個別設定顯示),若有法定排放標準則顯示預期平均每小時之數據供客戶參考。
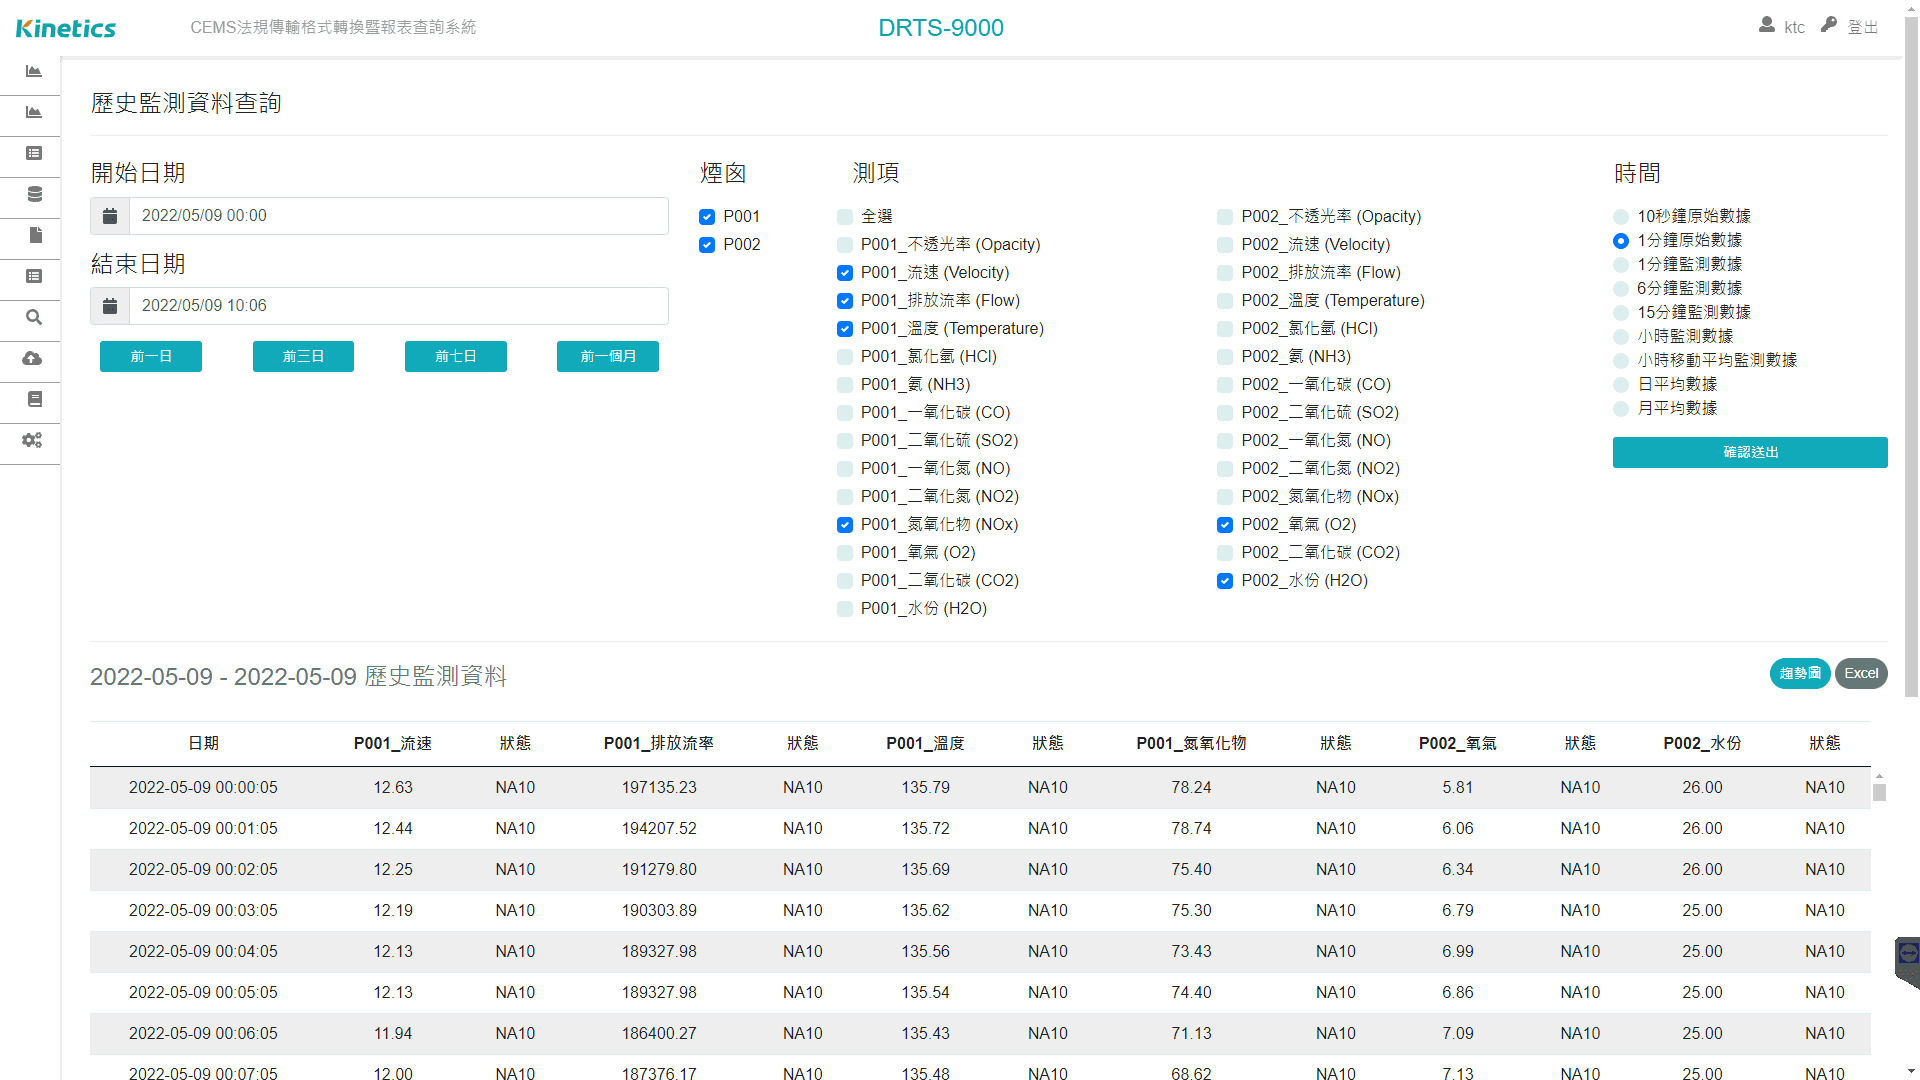
- 歷史數據,可選擇任意時間區間,同時/個別查詢所有管道/測項之原始數據分鐘值、監測數據分鐘值/6 分鐘值/15 分鐘值/小時值、日平均/月平均;可以表單或趨勢圖形式表現,表單可匯出 Excel 格式檔案,而趨勢圖則可另存圖形格式檔案並指定儲存路徑及檔案名稱,趨勢圖中各測項可分別設定不同顏色以利區隔。
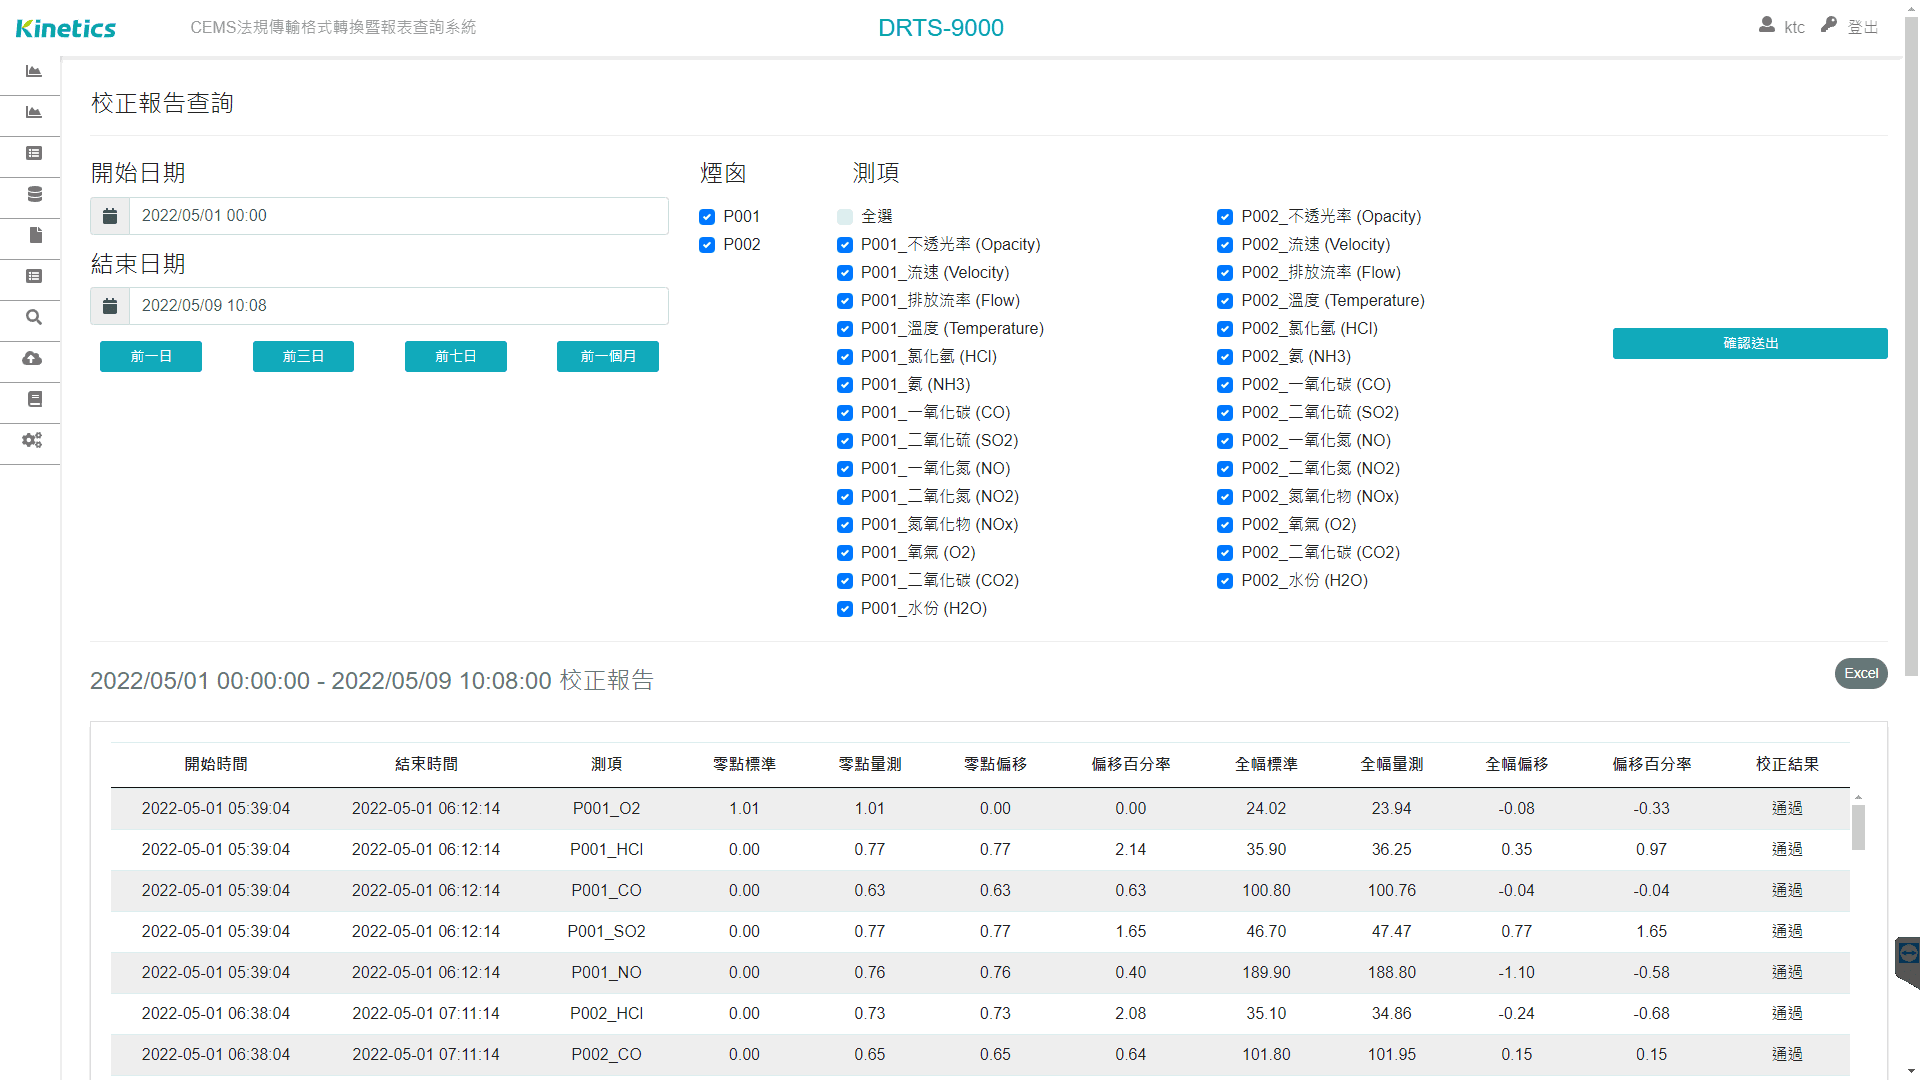
- 校正報告,可選擇任意時間區間,同時/個別查詢所有管道/測項之校正數據及結果,以表單形式顯示並立刻匯出 Excel 格式檔案並指定儲存路徑及檔案名稱。
- 月報輸出頁面,可手動產生/刪除月報,提供每月使用燃料輸入介面,可預覽摘要資訊,可選擇匯出法規傳輸格式文字檔案或 Excel 備查表。
- 資料補檔,可選擇時間區間重新產生即時傳輸檔案或日報文字檔、日報 Excel 檔。
- 檢視日報,可於網頁上檢視前一日之前 (包含前一日) 所有日期之日報,若有缺資料則會彈出告警視窗。
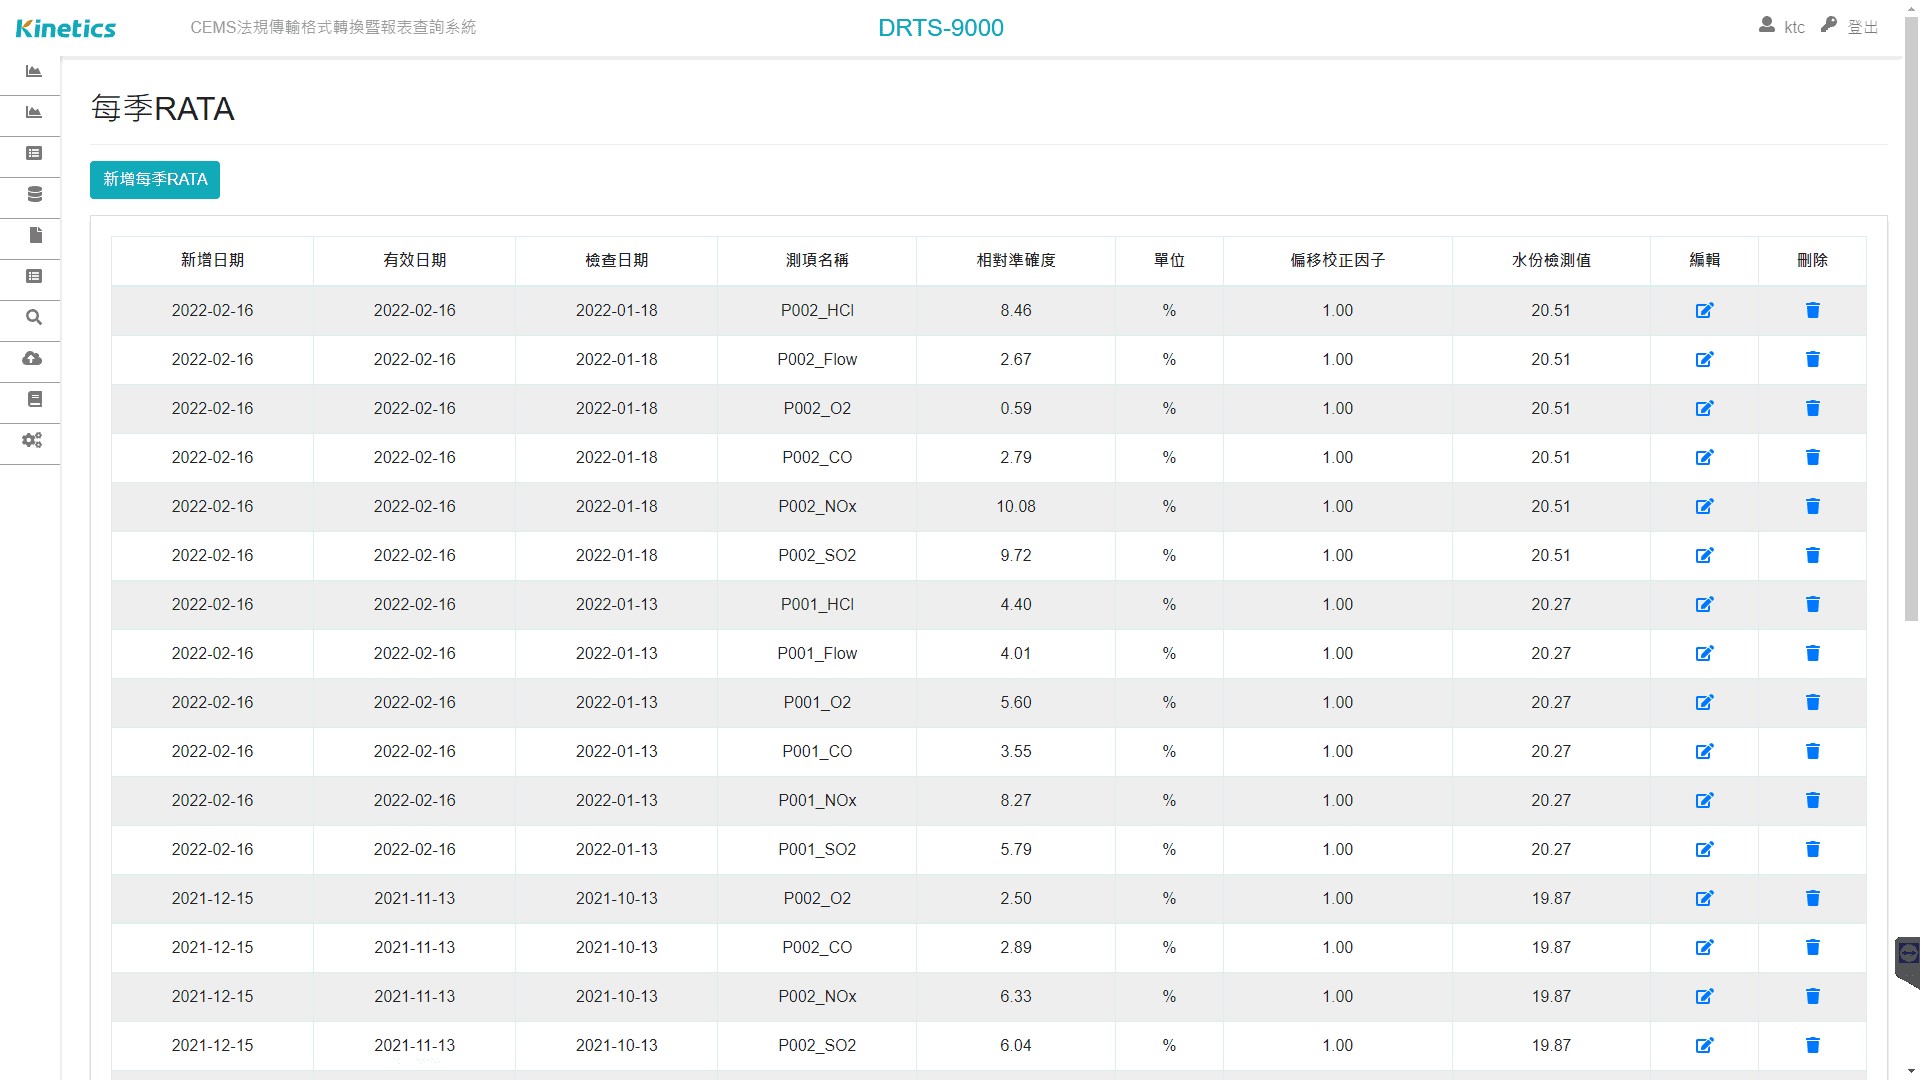
- 其他資料輸入,提供不透光每季查核、替代數據設定、相對準確度測試查核、每季氮氧化物轉化效率測試等輸入介面。
- 使用者設定,可新增使用者並設定是否接收警報訊息及每一分頁檢視權限。
- 可切換目前為測試階段或連線確認報告書送審正式核可後正式連線階段。
- 提供客製化報表服務。